Why your Shopify store isn't converting – and what to fix first
By Joe Tuckwell
2nd September 2026


The store is live and traffic is coming in, but the sales aren't where they should be. Visitors arrive and then quietly leave.
It's the problem MoreSoda sees most often when we first look inside a Shopify store, and the cause is rarely a mystery. Most advice on fixing it, though, tells merchants to address the wrong things first. This article sets out the sequence that actually works.
MoreSoda is a Shopify agency based in Bath, working with ecommerce brands across the UK on conversion, performance and ongoing growth.
Shopify CRO – conversion rate optimisation – is the process of increasing the percentage of visitors to a Shopify store who complete a purchase, rather than leaving without buying. It works by identifying exactly where in the buying journey people are dropping off, then addressing those specific points systematically. The average Shopify store converts between 1.4% and 3.2% of its visitors into customers, so improving that figure by even one percentage point, without increasing traffic, can add tens of thousands of pounds to annual revenue for a mid-sized store.
What your conversion rate actually means – and why Shopify calculates it differently
A Shopify conversion rate and a Google Analytics conversion rate will almost never match, and both can still be right – they're measuring different things.
Before improving a conversion rate, it helps to understand what's actually being measured, since Shopify and Google Analytics 4 calculate it differently, and the mismatch between the two figures is what tends to unsettle merchants.
The formula itself is simple:
Conversion rate = (Number of orders ÷ Number of sessions) × 100
So if 10,000 people visit a store in a month and 200 buy something, the conversion rate is 2%.
Where it gets more involved is that Shopify calculates this using sessions rather than unique users. A session is a single period of activity that resets after 30 minutes of inactivity or at midnight, so if the same person visits a store three times in a week and buys on the third visit, Shopify counts three sessions and one conversion. The resulting conversion rate will look lower than it would if unique buyers were being measured against unique visitors.
Google Analytics 4, by contrast, uses its own event-based tracking and counts conversions differently depending on how it's configured. Because Shopify's checkout redirects to a different domain for some payment flows, and because cookies are blocked more aggressively on mobile, GA4 tends to undercount purchases – which means its conversion rate figure can look lower again than Shopify's.
The practical implication is that Shopify conversion rate and GA4 conversion rate shouldn't be compared on the assumption that one of them is wrong. Shopify Analytics works best as the primary benchmark for conversion rate, while GA4 is more useful for understanding where people drop off and which channels perform best. The two are complementary rather than competing.
If both tools aren't configured and tracking properly, measuring any subsequent optimisation work becomes considerably harder.
The report to use in Shopify is Conversion Rate Over Time, found in the Analytics dashboard, and it's the figure this article refers to throughout. For the funnel view – where in the journey people are dropping off – the relevant report is Conversion Rate Breakdown, which Step 1 below covers.
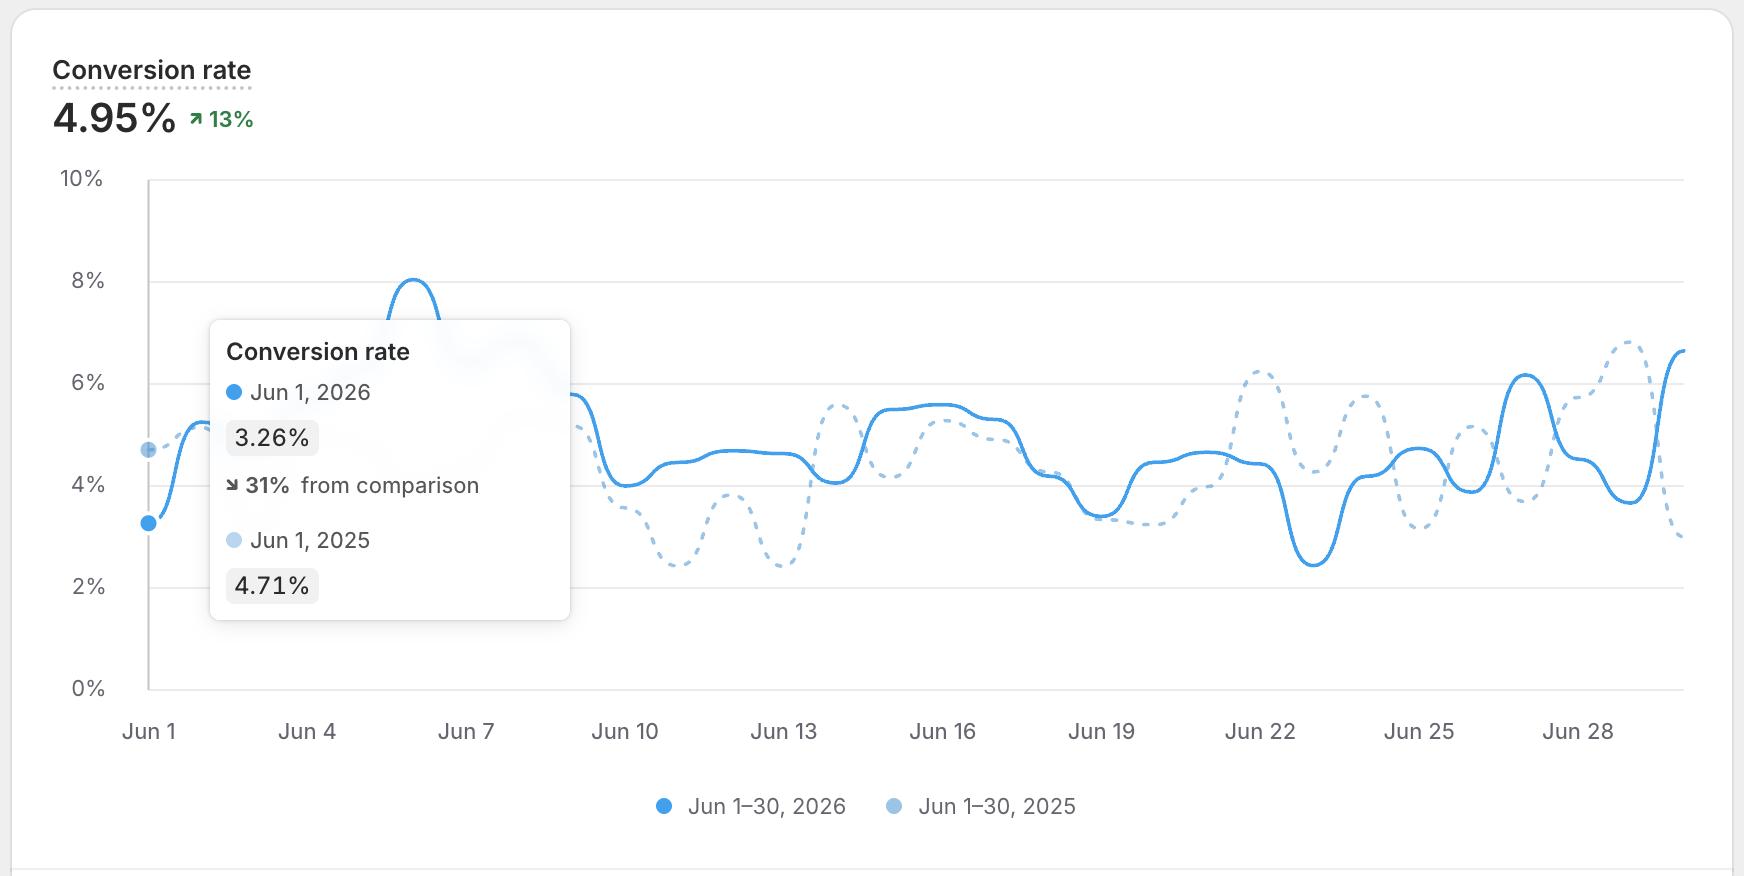
TOP TIP: For a more accurate figure, use the filter to exclude Bot traffic from your report.
What is a good Shopify conversion rate in 2026?
Rather than relying on generic averages, it's worth focusing on industry-specific benchmarks: a 2% conversion rate could be outstanding for a high-end jewellery retailer, but poor for a food and drink brand.
The short answer is that most Shopify stores sit between 1.4% and 3.2%. Above 3.3% puts a store in the top 20% globally, and above 4.7% in the top 10%.
But those figures hide an enormous range by sector:
Store type | Typical range | Why |
|---|---|---|
Food & drink | 4%–6% | Repeat purchases, low price, impulse buying |
Health & beauty | 3%–5% | High intent, researched purchase |
Fashion & apparel | 2%–3.5% | High browse, moderate purchase intent |
Home & furniture | 1%–2% | High consideration, large spend |
Luxury & jewellery | 0.8%–1.5% | Very high consideration, aspirational |
According to IRP Commerce data, the UK ecommerce average conversion rate sat at around 3.4% in early 2026 – higher than many global benchmarks, largely because UK shoppers are experienced online buyers who tend to arrive with higher purchase intent. Against that backdrop, a UK store converting at 2% is performing below the domestic average, even if it looks acceptable against global Shopify benchmarks.
The more useful benchmark, though, is a store's own historical performance. A store converting at 1.8% six months ago and 1.4% now has a problem worth solving, regardless of what sector averages suggest, since CRO is really about consistent, measurable improvement against a store's own baseline.
Conversion rate also isn't the only number that matters. A store converting at 1.5% with a £120 average order value earns more per hundred visitors than one converting at 3% with a £40 average order value – a point covered in more detail later in this article.
Why most merchants fix the wrong thing first
Changing button colours before establishing why people are leaving is a bit like taking a headache tablet before checking whether new glasses are needed: the symptom might ease briefly, but the underlying problem remains.
Store owners tend to start in the wrong place not because they're doing anything unreasonable, but because the most visible parts of a store are rarely the parts that are actually failing. These are the four mistakes MoreSoda sees most often when auditing a Shopify store for the first time.
Fixing design before fixing speed. A beautifully redesigned product page that takes four seconds to load on mobile will still convert worse than a plainer page that loads in one second, since page speed affects every visitor on every page before they even see the design. Addressing speed first tends to multiply the value of every improvement that follows.
Adding apps before removing friction. The Shopify App Store is full of tools that promise to increase conversions, and many genuinely do, for some stores. But every app installed adds code to a store, slows it down, and introduces a potential point of failure. It's common to audit a store where the conversion problem is largely caused by the very apps installed to fix it – which is why it's worth auditing what's already there before adding anything further.
Optimising product pages before fixing mobile. Over 70% of Shopify traffic comes from mobile devices, yet most merchants test their store on desktop, rewriting product descriptions, rearranging images and adjusting CTAs, then wondering why none of it moves the numbers. If the mobile experience is broken, no amount of product page work will fix the overall conversion rate, so mobile is usually where attention should go first.
Running more ads before fixing conversion. This is the most expensive of the four. If a store is converting at 1% and ad spend doubles, so does the number of people who visit and leave without buying, meaning twice as much has been paid to achieve the same result. More traffic to a store that isn't converting isn't growth so much as accelerated loss, which is why conversion is worth fixing before traffic is scaled.
The more reliable approach is to diagnose before prescribing: establish where the leak is, address it, measure the result, then move on to the next thing – which is what the following sections set out.
Step 1: Diagnose before you touch anything
A leak that hasn't been found can't be fixed, so it's worth spending an hour in the data before changing anything on the store. It tends to save months of guesswork later.
A conversion audit sounds more technical than it is. It's simply the process of establishing where people are leaving a store and why, before attempting to fix anything, and it has three parts: quantitative data (the numbers), qualitative data (the behaviour), and the drop-off map.
Part 1: The numbers – Shopify Analytics
In the Shopify admin, under Analytics, the relevant report is Conversion Rate Breakdown, which shows the percentage of sessions reaching each stage of the purchase journey:
- Sessions: everyone who visited
- Product page views: people who looked at at least one product
- Add to cart: people who added something to their cart
- Reached checkout: people who started the checkout process
- Purchased: people who completed an order
Working through these from bottom to top tends to be the clearest way in. A low purchase rate alongside a reasonable reached-checkout rate points to a problem in checkout itself – shipping costs, payment options, trust. A low add-to-cart rate alongside high product page views points to the product page. And where very few people are viewing product pages at all, the issue is more likely to sit with navigation, site structure, or traffic quality.
A few figures worth benchmarking against: add-to-cart rate typically sits at 5%–10%, and anything below 3% suggests a product page or trust problem. Cart abandonment of 65%–75% is normal, while anything above 80% suggests a specific friction point. Checkout completion should sit around 60%–70%; below 50% usually points to a surprise cost or a payment issue.
Whatever emerges as the single biggest drop-off point is the place to start.
Part 2: The behaviour – heatmaps and recordings
While the numbers show where people leave, behaviour tools help explain why. Microsoft Clarity, Hotjar and Lucky Orange all integrate with Shopify and offer free or low-cost plans, and once one is installed, two things are worth doing.
The first is watching session recordings filtered to mobile users who visited a product page but didn't add to cart. Ten or so is usually enough to reveal patterns – elements people click that don't do anything, content scrolled past without being read, forms that are confusing on a small screen.
The second is setting up a heatmap on the most visited product page, to see where people click and where they stop scrolling. If most visitors never scroll far enough to see the add-to-cart button, that's a fix that can often be made in an afternoon.
Part 3: The drop-off map
Bringing the two together – the numbers and the behaviour – should point to a single biggest drop-off point, the stage where the store loses the most people. That becomes the focus of everything that follows, rather than trying to fix everything at once.
Not sure what the data is showing?
A Conversion Rate Breakdown report can take some getting used to. MoreSoda's Support & Growth team can talk through the data and help work out what to prioritise.
Step 2: Fix the foundation – speed and mobile
A slow store behaves like a leaking bucket: traffic can keep being poured in, but until the leak is fixed, most of it drains away before converting.
Once the leak has been located, the temptation is to go straight to fixing that specific page. It's usually better resisted. Unless the audit has identified a very isolated problem, the most effective first step for almost every Shopify store is speed and mobile experience.
An ecommerce page that loads in one second converts up to three times better than one that takes five seconds – the difference between a store that's genuinely thriving and one that looks successful on paper while quietly losing money. A 0.1-second improvement in mobile load time has been shown to increase conversion rates by 8% in retail, and Google uses Core Web Vitals, a set of speed and stability metrics, as a ranking signal. A slow store doesn't just lose conversions directly; it loses some of the organic traffic that would otherwise have had the chance to convert.
How to check a Shopify store's speed
Google PageSpeed Insights is the standard tool, and it's worth running for mobile first rather than desktop, since that's where most traffic sits and where the score tends to be worse. A score above 70 is a reasonable minimum, above 85 is good, and above 90 suggests speed is no longer the main issue. Shopify also provides its own speed score under Online Store > Themes, which is useful as a relative benchmark against other Shopify stores, though PageSpeed Insights gives a more actionable diagnosis.
What to fix, in order of impact
Most of the following doesn't require a developer:
- Compress images. Images are almost always the biggest contributor to slow load times on Shopify stores. Product images work well under 200KB, and tools like TinyPNG or Squoosh handle compression before upload, or a Shopify app like Crush.pics can automate it.
- Switch to WebP format. WebP images are roughly 30% smaller than JPEGs at equivalent quality. Shopify serves WebP automatically to browsers that support it, provided the original images are high quality – uploading originals at 2000px wide and letting Shopify optimise them tends to work well.
- Remove unused apps. Every app installed, even one that's no longer actively used, may still be loading scripts on the storefront. The theme's code editor shows which app scripts are loading on which pages, making it easier to remove anything no longer needed.
- Avoid heavy sliders and autoplay video in the homepage hero. These are the single most common cause of slow Shopify homepages. A static hero image with good copy tends to convert better than an animated carousel, and loads considerably faster.
- Check the theme. Some Shopify themes prioritise visual impact over speed. If the PageSpeed score is still below 50 after fixing images and removing unused apps, the theme itself may be the constraint. Shopify's own Dawn theme is among the fastest available, and switching to a lighter theme is a significant decision but often the one with the most dramatic speed impact.
Mobile-specific fixes
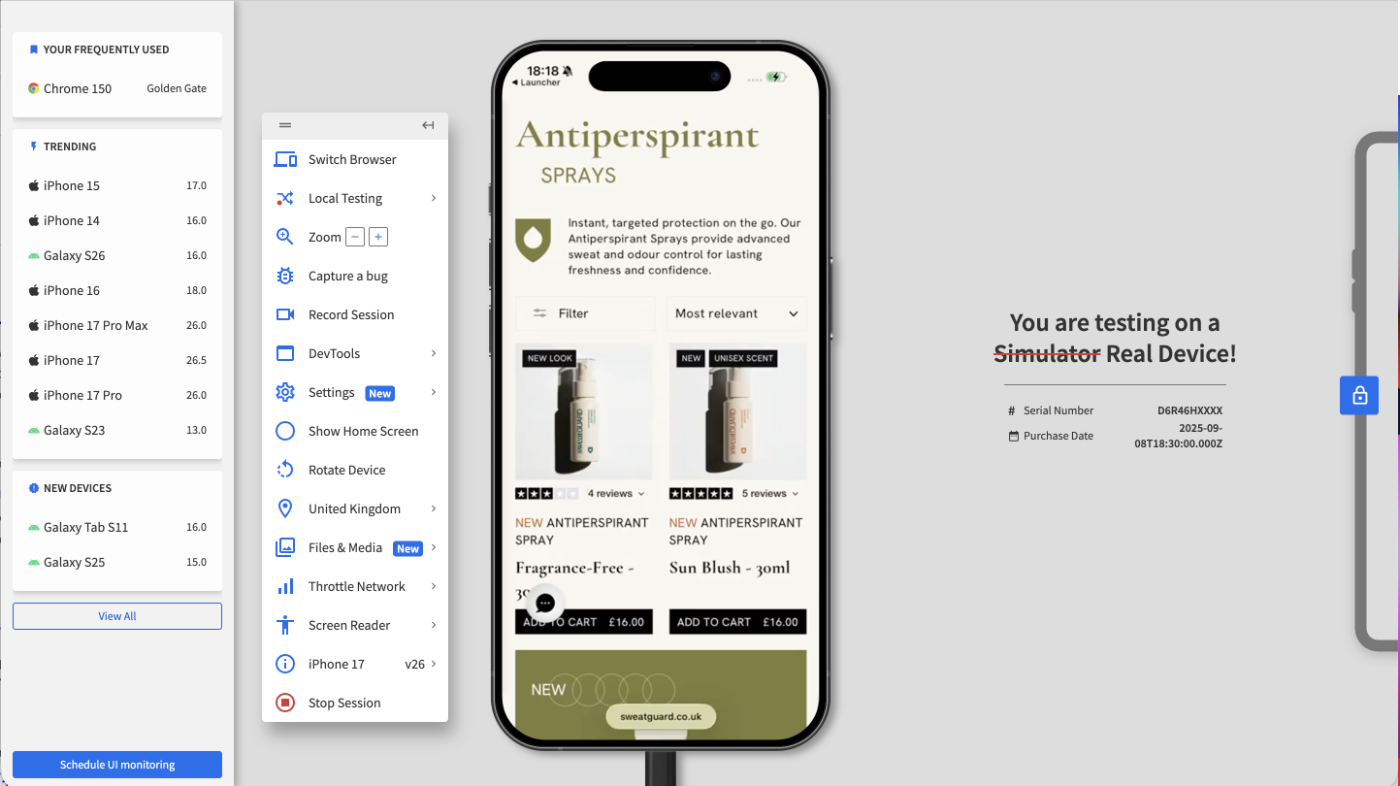
Testing on an actual mobile device - either physical or through a testing platform like BrowserStack, rather than a resized browser window, tends to surface issues a desktop view misses. Worth checking while finding a product and adding it to cart: can the product title, price and description be read without zooming? Is the Add to Cart button visible without scrolling on the first product landed on? Are any tap targets small enough to risk being tapped by mistake? Does a full-screen popup appear immediately on mobile – these are worth removing outright, since Google penalises them and users tend to dislike them.
Addressing whatever surfaces in this walkthrough is worth doing before moving on to the next step.
Step 3: Fix your product pages
A product page's job is to answer "why should I buy this today?" – most only answer "what is this?", which isn't quite enough on its own.
Once the foundation is solid, product pages tend to be where the biggest conversion gains live. A small improvement on the most visited pages – typically the top five or ten SKUs that receive most of the traffic – usually moves the overall conversion rate more than any other single change.
What most product pages get wrong
Most Shopify product descriptions answer a single question: what is this product? They list features, dimensions, materials and specifications, which is necessary information, but not quite enough to prompt a purchase on its own.
What tends to convert is a different question: why should this be bought today, from this store, rather than elsewhere or not at all? That breaks down into three parts.
- Who is this for? A description speaking directly to the reader's specific situation tends to convert better than a generic one – "perfect for marathon runners managing knee pain" rather than "suitable for running".
- What problem does it solve? Benefits tend to convert better than features – "stays sharp for six months of daily use" rather than "high-carbon steel blade".
- Why from this store, right now? This is where trust signals, guarantees and urgency elements earn their place, provided they're genuine.
Images and video
Images matter disproportionately on Shopify product pages, since customers can't touch, try or examine the product itself. At least four images per product – front, back, detail/close-up, and lifestyle – tend to work well, alongside a size or scale reference and zoomable high-resolution images, which Shopify supports natively provided it's switched on. Video matters increasingly too, particularly for fashion, beauty and home products; even a ten-second clip showing the product in use, filmed on a modern smartphone, can noticeably increase add-to-cart rates, and doesn't need to be professionally produced.
Trust signals near the CTA
The area immediately around the Add to Cart button tends to be the highest-value space on a product page, and everything a customer needs to feel confident is worth having visible there without scrolling:
- Star rating and number of reviews, ideally linking to the reviews section below
- A clear, specific returns policy – "30-day free returns, no questions asked" tends to outperform "see our returns policy"
- A delivery time estimate – "order before 2pm for next-day delivery" rather than "fast delivery"
- Payment method icons – Shop Pay, Apple Pay, PayPal, Klarna – signalling that checkout will be straightforward
Product information structure
Tabs or accordions work well for detailed information – materials, sizing guides, care instructions, FAQs – keeping the page scannable while still making that detail available to anyone who wants it. Critical information such as price, variants, delivery and returns is worth keeping visible without clicking or scrolling; the more detailed material can sit inside an accordion.
Still not converting after all this?
Where product pages have been rewritten, images compressed and checkout addressed, and the conversion rate still hasn't moved, the problem is usually structural rather than something a further description rewrite will fix. MoreSoda works with Shopify stores to find and address the underlying issues that generic advice tends to miss, as part of our ongoing Support & Growth plans.
→ Talk to MoreSoda about your store
Step 4: Fix checkout friction
Surprise costs at checkout are the single biggest cause of abandoned carts, and where someone is already willing to buy, removing every remaining reason for them to change their mind tends to pay off.
Between 65% and 75% of Shopify carts are abandoned before the customer completes their purchase. That's the industry average, and not in itself a sign that a store is broken, though it does mean three out of every four people who wanted to buy something changed their mind between adding to cart and paying. Most of these abandonments are recoverable, since they tend to happen for predictable, fixable reasons.
The biggest cause: surprise costs
Study after study on cart abandonment points to the same primary cause: unexpected costs appearing at checkout, whether that's shipping fees not visible on the product page, taxes added at the final step, or handling charges that appear from nowhere. The fix is transparency, earlier – displaying shipping cost or a free shipping threshold on the product page, and stating any free shipping offer clearly near the Add to Cart button rather than leaving it buried in the footer. Customers who know what they'll pay before reaching checkout tend to be considerably less likely to abandon once they get there.
Checkout friction points
After surprise costs, the most common reasons for checkout abandonment on Shopify are:
- Being forced to create an account – guest checkout works better as the default, with account creation offered afterwards, which Shopify supports natively
- Too many form fields – worth asking only for what's genuinely needed
- Limited payment options – offering only card payments in 2026 is a real handicap; Shop Pay, Apple Pay and Google Pay are worth enabling as a minimum, with Klarna or Clearpay worth considering for higher-ticket items, since buy-now-pay-later options measurably increase conversion for purchases above £50
- Slow load times at checkout, often caused by the same heavy app scripts affecting the rest of the store
Where a meaningful share of traffic comes from outside the UK, international customers and currency conversion is worth checking too, since an unfamiliar currency at checkout is its own source of abandonment.
Abandoned cart recovery
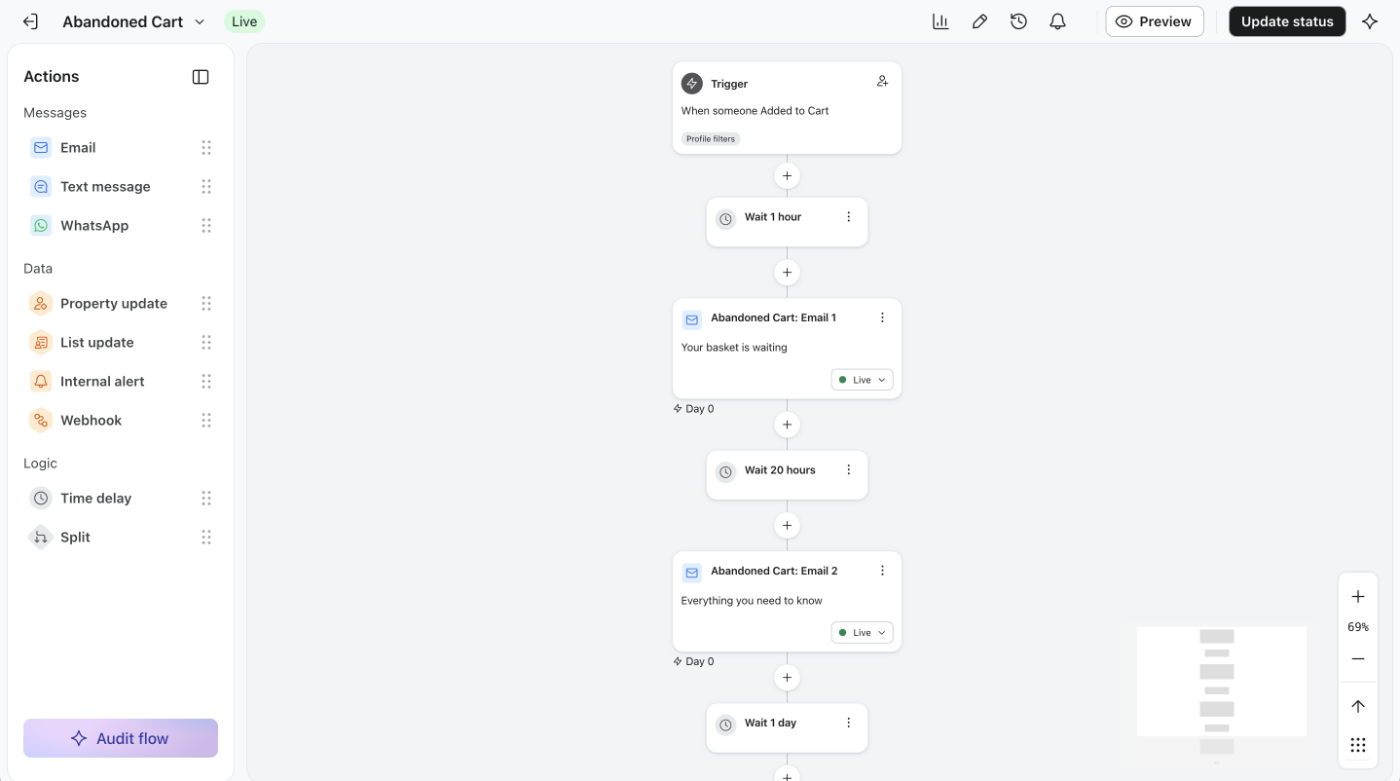
Even a well-optimised checkout won't recover everyone, which is why abandoned cart email and SMS sequences work better as a safety net than a primary solution. The sequence that tends to work for most stores:
- One hour after abandonment: a simple reminder with no discount – "you left something behind" and a clear link back to the cart.
- Twenty-four hours after: more detail – product information, reviews, a reminder of the returns policy, reassurance rather than urgency.
- Three days after: the point at which a discount, if one is offered at all, tends to work best. Offering it any earlier risks training customers to abandon carts deliberately, in the expectation of a discount to follow.
Klaviyo is the most widely used email platform for Shopify abandoned cart flows and integrates directly with store data.
Step 5: Test – but only once there's enough data
A/B testing is one of the most powerful tools in CRO, and largely useless on a store with 500 monthly visitors.
Once the foundation, product pages and checkout have been addressed, and there's data showing those changes have moved the numbers, structured testing becomes worthwhile – the point at which "this should help" can start to be replaced with "this works".
What A/B testing actually involves
An A/B test shows different versions of the same page to different groups of visitors simultaneously, then measures which version produces more of the desired outcome – usually purchases or add-to-carts. Simultaneously is the key word: testing version A this week and version B next week isn't comparable, since too many other variables shift week to week – traffic source, day of week, promotions, weather. Both versions need to run at the same time.
That, in turn, means enough traffic to show both versions to enough people for the result to mean anything. As a rough guide, around 100 conversions per variation is needed for a result to be trustworthy. A product page with 1,000 visitors a month converting at 2% generates 20 conversions a month per version, which would take five months to reach significance – not a useful timeframe. Below around 10,000 visitors a month, formal A/B testing usually isn't the priority yet, and the previous steps tend to offer larger, faster gains than testing can.
What's worth testing once ready
- Product page headline or title – whether leading with the product name or the key benefit produces more add-to-carts
- Hero image on the homepage – lifestyle vs product on white background vs model, which varies significantly by sector
- CTA button copy – "Add to cart" vs "Buy now" vs "Get yours today", where small changes can have surprising effects
- Free shipping threshold – testing for the value that produces the most revenue per visitor, not just the most conversions
- Trust signal placement – above vs below the CTA vs within the product description
Testing tools for Shopify
Shopify doesn't have a built-in live A/B testing tool for storefront traffic, though it does now offer SimGym, a free first-party app that uses AI shoppers to simulate buyer behaviour and stress-test theme or layout changes before they go live – useful as a pre-check before committing to a real test, though it's a simulation rather than a substitute for one.
For most stores without SimGym, the simplest approach is switching manually between versions using the theme's built-in sections and comparing periods – not statistically pure, but useful as directional guidance. For more rigorous testing, tools such as Shoplift and Intelligems integrate natively with Shopify's theme editor without significantly affecting site speed; tools that load external scripts late on the page are worth avoiding, since the added latency can itself affect conversion rate.
A log of every test — what was tested, the hypothesis, the result, and the decision made – tends to compound in value over time. Six months of testing builds into a playbook specific to a store's own customers and products, which is why most stores that stick with it treat ongoing CRO as a monthly programme rather than a one-off project.
The conversion metric that's often overlooked
A higher conversion rate doesn't always translate into more revenue. The figure that actually matters is revenue per visitor – conversion rate multiplied by average order value.
Most CRO content focuses entirely on conversion rate, which is really a behaviour metric rather than a revenue one. A store converting at 3% with a £35 average order value is making less money per hundred visitors than a store converting at 2% with a £70 average order value.
Revenue per visitor = Conversion rate × Average order value
A store with 10,000 monthly visitors, a 2% conversion rate and a £50 AOV generates £10,000 in monthly revenue. The same store with a 2.5% conversion rate and a £60 AOV generates £15,000 – a 50% increase in revenue from a fairly modest improvement in both metrics.
Because of this, CRO and AOV tend to work best when addressed together. The same fixes that improve conversion rate – better product pages, stronger trust signals, clearer pricing – often lift average order value too, since customers who feel more confident in what they're buying tend to add complementary products more readily.
Three ways to lift AOV alongside CRO
- Setting the free shipping threshold 20–30% above the current average order value tends to work well. With an AOV of £40 and free shipping kicking in at £50, customers who were going to spend £40 will often add another item to reach it – a progress bar in the cart ("Add £8 more for free shipping") is one of the higher-converting elements a Shopify cart can include.
- Complementary product recommendations, such as "frequently bought together" and "complete the look" blocks, tend to lift both AOV and conversion rate where the recommendations are genuinely relevant; Shopify's Search and Discovery app handles this natively.
- Post-purchase upsells, shown immediately after the customer completes their purchase, tend to work well because payment has already been taken and there's no remaining checkout friction – the customer simply clicks to add the item. Conversion rates on post-purchase offers typically run at 8–15%.
A 90-day Shopify CRO plan
CRO isn't really a project that gets completed so much as a rhythm built into how a store is run – monthly reviews, quarterly sprints, continuous improvement. What follows is a practical 90-day structure MoreSoda uses with new clients.
Month 1 – Diagnose and fix the foundation.
Week 1: complete the conversion audit using Shopify Analytics, identify the biggest drop-off point, and install a session recording tool. Week 2: run PageSpeed Insights on the homepage, most visited collection page and most visited product page, and address the top three speed issues. Week 3: complete the mobile walkthrough and fix every friction point found. Week 4: review session recordings, note recurring patterns, and document findings and next priorities.
Month 2 – Fix the highest-impact pages.
Attention turns to the drop-off point identified in month 1. Where that's product pages, rewriting the top five using the framework in this article – benefit-led copy, images with scale reference, trust signals near the CTA – tends to be the priority. Where it's checkout, the settings worth auditing are guest checkout, accelerated payment options, and how early shipping costs are shown in the journey. An abandoned cart email flow is worth setting up if one isn't already in place – three emails, at 1 hour, 24 hours and 3 days.
Month 3 – Measure, iterate, begin testing.
Comparing conversion rate data from month 3 against month 1 is the point at which meaningful movement should start to show – a 0.3–0.5 percentage point improvement is significant at this stage. The next highest-impact area can then take the same process. Where monthly visitor count is above 5,000 and conversion data is consistent, this is also a reasonable point to run a first structured A/B test on a high-traffic page.
Seasonal timing is worth building in too. For most UK ecommerce stores, Black Friday, Christmas and the post-Christmas sale are the three periods where traffic spikes most dramatically, and any improvements intended for those periods need to be implemented and tested at least four weeks beforehand, rather than during the run-up itself, when structural changes are best avoided. A simple content calendar working backwards from peak dates tends to help: what needs to be fixed by when, and what that means for when work needs to start.
Support running this month to month
MoreSoda's Support & Growth plans cover exactly this kind of work – CRO and UX reviews, technical performance, and ongoing implementation – alongside the rest of what a store needs day to day. It's flexible, hours-based support rather than a fixed package, so it scales with what's actually needed.
Why is my Shopify conversion rate so low?
A low Shopify conversion rate tends to be a symptom of a specific problem in the buying journey, rather than a general failing of the store. The most common causes are slow page speed on mobile, a lack of trust signals near checkout, surprise shipping costs appearing late in the process, and product pages that describe the product without quite convincing the customer to buy. A conversion audit, establishing exactly where people are leaving, is the usual starting point before addressing that specific point.
Why am I getting traffic but no sales on Shopify?
Traffic without sales usually points to one of three things: the traffic isn't well-matched to what's being sold, and visitors are curious rather than buying; the store has a trust problem – missing reviews, unclear policies, no recognisable payment options; or there's a specific friction point turning buyers into abandoners. Watching session recordings of mobile visitors who landed on a product page but didn't add to cart tends to be the most reliable way to identify which of the three is at play, and the answer usually becomes clear within ten recordings.
How does Shopify calculate conversion rate?
Shopify calculates conversion rate using sessions rather than unique visitors. A session is a single period of activity that expires after 30 minutes of inactivity or at midnight, so a visitor who returns three times and buys on the third visit is counted as three sessions and one conversion. This is why a Shopify conversion rate tends to sit lower than expected, and why it differs from the Google Analytics figure, which uses a different calculation method. The Conversion Rate Over Time report in Shopify Analytics is the more reliable primary benchmark, but remember to filter out Bot traffic from your report.
What is a good Shopify conversion rate in the UK?
UK ecommerce benchmarks sit slightly above global averages, largely because UK shoppers tend to arrive with high purchase intent. A rate above 3% is strong territory for most sectors, though the sector itself matters considerably – food and drink stores regularly convert at 5–6%, while luxury and jewellery stores may convert at under 1% without that being a problem. The most meaningful benchmark tends to be a store's own historical performance, since consistent improvement month on month matters more than hitting any particular figure.
Should I focus on traffic or conversion rate first?
Where conversion rate sits below 2%, conversion is usually worth fixing first. Adding traffic to a store converting at 1% means paying for a hundred visitors to get one sale, whereas lifting conversion to 2.5% first turns that same traffic budget into two and a half sales per hundred visitors – two and a half times the return on ad spend. More traffic simply amplifies whatever the conversion rate already is, so the rate is worth addressing before the traffic is scaled.
How long does it take to see results from Shopify CRO?
Small targeted fixes – compressing images, enabling guest checkout, displaying shipping costs earlier – can produce measurable results within two to four weeks, given sufficient traffic. Larger changes, such as rewriting product pages or redesigning the mobile experience, typically take six to eight weeks to show clear results, since enough post-change data is needed to compare against the baseline. Significant, sustained improvement in conversion rate usually requires around three months of consistent work – it tends to be a process rather than a one-off project.
Which Shopify theme converts best?
No theme guarantees high conversion on its own; speed, clarity and how well the theme suits the products and customers matter more. That said, lightweight themes built on Shopify's Online Store 2.0 architecture, such as Shopify's own Dawn theme, tend to outperform heavily customised, animation-heavy themes on mobile conversion metrics, largely because they load faster, which remains the single biggest determinant of mobile conversion rate. Where a current theme scores below 60 on Google PageSpeed Insights for mobile, switching to a faster theme is worth seriously considering.
Where your store might be losing revenue
MoreSoda is a Shopify agency based in Bath. We work with established Shopify stores across the UK to diagnose conversion problems and address them in the right order, as part of our ongoing Support & Growth work.
Most Shopify stores lose the majority of their potential revenue at one or two specific points in the buying journey, and those points are almost always fixable once identified. The approach this article describes is how MoreSoda works with clients: diagnose first, address issues in the right order, measure the result, repeat. It isn't complicated, though it does require looking inside the data before anything is changed.
If MoreSoda's help with that diagnostic work – alongside you or on your behalf – would be useful, get in touch and we can talk through your store, your data, and what we'd address first.