5 Underrated Ecommerce Metrics You Should Track
By Joe Tuckwell
4th February 2025


Most online retailers focus on the same set of metrics - conversion rates, average order value, customer lifetime value and cost per acquisition. While these measurements are vital for understanding your performance, they only tell part of your business story. Insights often lie in the less obvious numbers that help to paint a clearer picture of your customers' behaviour and your operational efficiency.
By looking beyond standard analytics, you'll spot opportunities that your competitors might miss. These metrics dig deeper into customer satisfaction, buying patterns, and operational challenges. They give you practical, actionable data to make meaningful improvements to your online store.
Let's explore five often overlooked metrics that could transform how you measure and improve your ecommerce performance.
1. Time between first visit and purchase
The gap between a customer's first interaction with your store and their purchase reveals key patterns in shopping behaviour. This timeline varies across product types and price points - luxury items naturally have longer consideration periods than less expensive buys. By measuring this duration, you can map out your customers' research phase and identify the touchpoints that influence decisions. For example, if data shows customers typically take two weeks to make a purchase, you can plan your email campaigns and social media content to maintain engagement throughout this period.
A good way to track this metric is with Google Analytics or your ecommerce platform's analytics tools. Focus on the time between a user's first tracked session and their conversion event.
In GA4, create a two step funnel Exploration with the first step set to ‘First open/visit’ and the second step as a ‘Purchase’ event. You can then use the elapsed time between the two events.
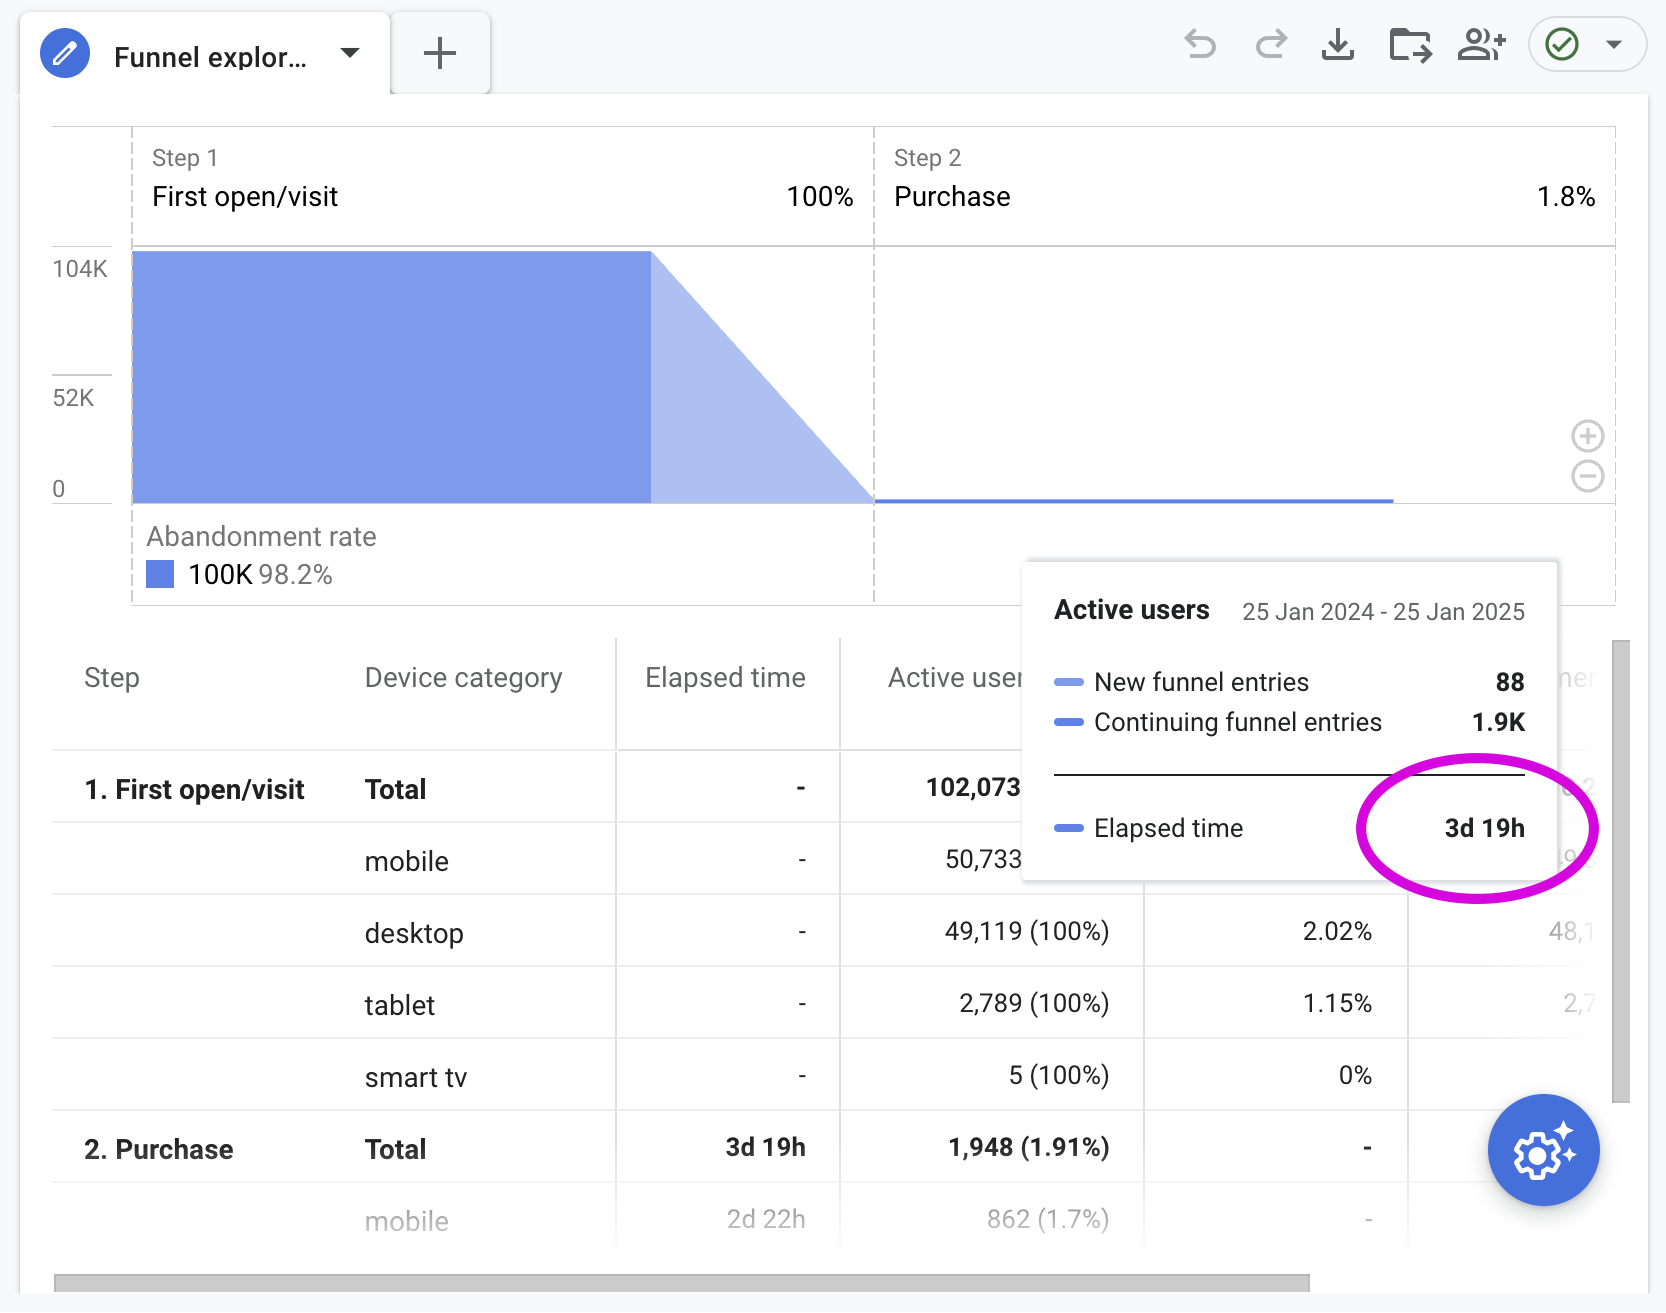
This insight helps you spot potential barriers in the customer journey. A longer-than-expected purchase time might indicate that your product information needs improvement. You can use this data to adjust your marketing, introducing promotions at key decision points or creating detailed comparison guides that address common customer concerns.
2. Cart abandon stage analysis
Identifying where customers drop off during checkout provides clear direction for store improvements. By breaking down the abandonment rate at each step, from cart to customer details to payment, you pinpoint exact friction points that need attention. Cart abandonment impacts businesses significantly, with global rates reaching 70.19%. If you notice, for example, a spike in abandonment when shipping costs appear, you might test free shipping thresholds or display estimated costs earlier in the journey.
Set up ecommerce measurement in Google Analytics 4 or use your platform's native checkout funnel analysis tools to monitor each step.
Shopify's native GA4 sales channel will automatically track the following events in GA4:
- page_view - A customer visited a page on your online store.
- search - A customer searched for a product on your online store.
- view_item - A customer viewed a product on your online store.
- add_to_cart - A customer added a product to cart.
- begin_checkout - A customer started the checkout process.
- add_payment_info - A customer successfully entered payment information.
- purchase - A customer completed their checkout.
The data often highlights surprising issues - perhaps customers abandon when asked to create an account, or when certain payment options aren't available. By analysing these patterns, you can make targeted improvements to your checkout process, such as streamlining form fields, adding express payment options, or adjusting your guest checkout experience to reduce friction points.
3. Refund and return rate
Tracking returns and refunds gives you direct insight into product satisfaction and potential issues in your customer experience. This metric goes beyond simple percentages, helping you spot patterns across product categories, seasonal variations, and customer segments. By monitoring which items get returned most often and why, you can identify issues with product descriptions, sizing information, or quality. If a specific product has a higher return rate, you might need better product photos or more detailed specifications.
Monitor this metric through your ecommerce platform's order management system or integrate with your returns management software - both Loop Returns and Aftership provide excellent reporting and analytics
Use this data alongside customer feedback and trends in return reasons. Are customers consistently citing size issues, quality concerns, or 'not as described'? Use these insights to improve product listings, update size guides, or even reconsider your product range to reduce return rates and increase customer satisfaction.
4. Purchase frequency
Purchase frequency reveals how loyal your customers are and how well your retention strategies work. This metric helps you identify buying patterns and segment your customer base effectively. By understanding how often different customer groups buy from you, you can create more targeted marketing campaigns. If data shows most customers buy seasonally, you can plan promotions and email campaigns to align with these natural buying cycles.
Calculate this metric by dividing the total number of orders by the number of unique customers over a specific time period. Look for trends in high-frequency buyers. What products do they prefer, which marketing channels brought them to you, what promotions trigger repeat purchases? These insights help you replicate success with other customer segments and improve your retention marketing strategy.
5 First response time (FRT)
Rapid customer service response shapes buying decisions and customer loyalty. First response time (FRT) shows how quickly your team addresses customer questions. Modern shoppers expect swift answers, with leading brands responding in minutes through live chat. Your customers compare your response speed to their experiences with major retailers, making rapid responses a competitive advantage.
Monitor FRT across all support channels, paying particular attention to peak trading periods. Live chat helps you meet customer expectations for immediate assistance with purchase decisions. For complex queries that need detailed attention, set clear response expectations. Use this data to allocate customer service resources effectively and develop a knowledge base for common questions.
These measurements go beyond basic analytics to show real customer experience. Regular analysis helps you spot potential barriers to purchase, strengthen customer relationships, and adapt your support strategy as your business grows.
Ready to take your online store's performance to the next level? Talk to our team at MoreSoda about building a data-driven ecommerce strategy.